React-Vis: Best Choice for Easy Charting in React
Core features and pleasing UI for basic use-cases

Introduction
We were recently tasked with building a simple data analytics page for a startup which included a bar chart visualizing page views over time.
A charting solution providing a clean UI and support for simple chart types such as bar charts, pie charts, and line charts is a common request among our startup clients. Early-stage requirements usually don’t include complex user interactions (e.g. zooming) or support for large datasets. Think a chart you could probably draw by hand, meant to be easily understood and visually pleasing.
Among charting solutions that exist for React, we settled on using React-Vis and plan to continue using this library in future use-cases. A shallow learning curve and out-of-the-box features give this library major advantages over competitors.
Pros
- Shallow Learning Curve
- Bar Charts, Pie Charts, Line Charts
- Support for Flex-box sizing (albeit with caveats)
- Easily customizable (axis labels, line widths, colors)
- Composable components and minimal boilerplate
Cons
- No auto-formatting of data (e.g. days of the week)
- No SSR support
- Tricky mouse interactions
- Lack of zoom or pan support
Sample Use
To illustrate some aspects of React-vis, here’s an incomplete starter boilerplate for how you may commonly use React-vis with Next.js.

As you can see, it looks great out-of-the box. Perfect for a data analytics page meant for the app users.
Comparison With Other Libraries
Recharts:

Also a robust solution built on top of d3.js, but looks more like it fits on an admin-dashboard or power-user view than a friendly web page. Much better for UI interactions (click, hover, zoom, pan).
react-chartjs-2:
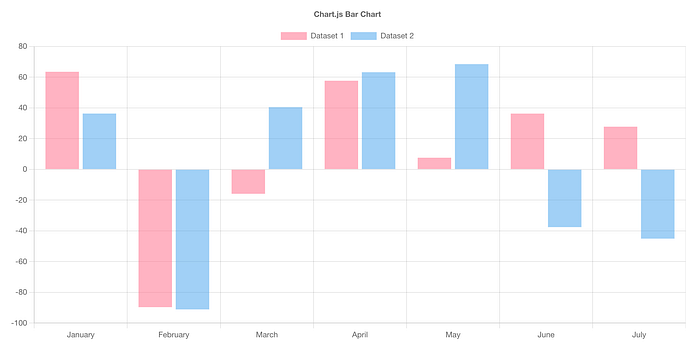
Beautiful charts, but a bit more complex as it’s built on top of a vanilla javascript solution chart.js. We prefer to avoid libraries with a focus on cross-framework support, as they aren’t always robust for React (more bug-fixes).
Victory:

The out-of-box UI is a bit over-designed. We prefer the simpler React-vis in this case. There’s also a lot of boilerplate to achieve custom styles.
Conclusion
React-vis strikes a good balance between features and simplicity. It makes it easy for developers to design visually pleasing charts for projects without spending a lot of time sifting through documentation.